When the State of Devs 2026 results appeared, I wanted to dig deeper than the charts on the website.
So I did the perfectly reasonable developer thing: built a scraper in Node.js and TypeScript, downloaded the underlying data, and started poking around. 5,463 respondents, a few large JSON files, and an entirely sensible amount of curiosity later, some patterns started to stand out.
This is my reading of the dataset. The survey is self-selected, correlations don’t establish causes, and a few country samples are small enough to deserve a raised eyebrow. Keep that in the back of your mind. There’s still plenty to explore.
AI-generated code is already normal
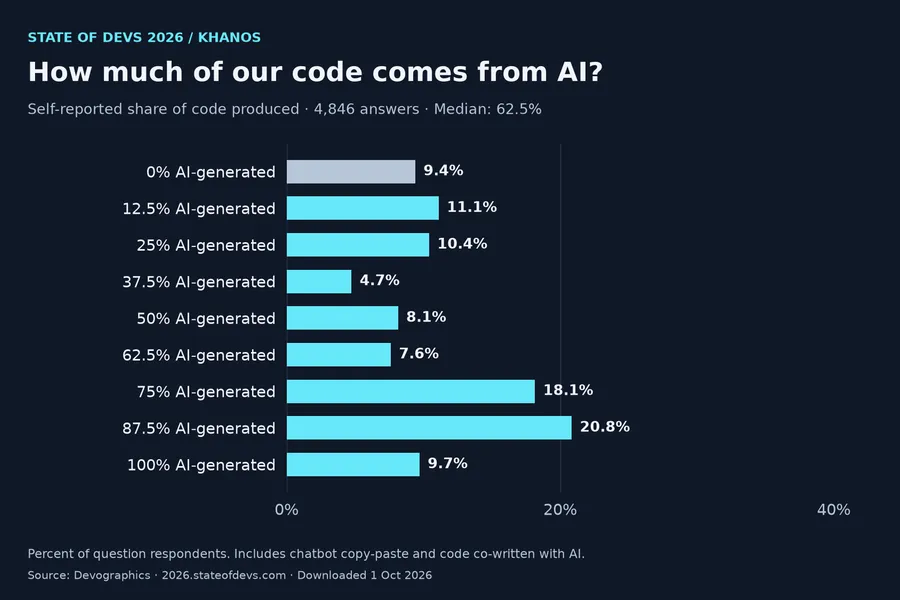
The striking number isn’t how many developers have tried AI. It’s how much of their code they say comes from it.
The average reported share is 56.1%, with a median of 62.5%. Roughly 48.7% reported that at least three quarters of their code is AI-generated.
How much code respondents say comes from AI
4,846 answers- 0% AI-generated9.4%
- 12.5% AI-generated11.1%
- 25% AI-generated10.4%
- 37.5% AI-generated4.7%
- 50% AI-generated8.1%
- 62.5% AI-generated7.6%
- 75% AI-generated18.1%
- 87.5% AI-generated20.8%
- 100% AI-generated9.7%
Self-reported estimates. Includes chatbot copy-paste and code co-written with AI tools. Source data
The question includes code copied from chatbots and code co-written with AI tools. These are personal estimates, not a Git history audit. But within this sample, AI-assisted development is clearly an ordinary workflow.
That makes “I use AI” a less interesting differentiator. If everybody can reach similar models, where does the engineering advantage come from?
A plausible answer lives around the model: agent workflows, useful context, tools connected through MCP, and tests that actually catch broken behaviour. Also the less glamorous stuff: understanding architecture, reading diffs, tracing a bug, and recognising when a confident answer is wrong.
A model with access to the right repository context and a way to run checks has a different job from a chatbot guessing what your backend looks like. Orchestrating that work is an engineering problem in its own right.
Prompting the model is becoming the easy part. Knowing whether its answer belongs in production is the harder skill. That’s an interpretation, not something a code-generation percentage can prove. The survey doesn’t measure the productivity or quality of those workflows.
Frontend is huge. AI/LLM work is still a smaller corner.
Using AI to write code and working on AI systems are different things. The work-area data makes that distinction nicely.
83.5% of people answering that question selected frontend JavaScript. 14.5% selected AI/LLM work. People could select more than one area, so these aren’t rival teams.
Lots of frontend; a smaller AI/LLM group
4,868 answers- Frontend JavaScript83.5%
- Median income
- $90,000
- Median experience
- 12 years
- Income / experience facet records
- 3,973 / 4,004
- AI / LLM14.5%
- Median income
- $125,000
- Median experience
- 15 years
- Income / experience facet records
- 691 / 694
Multiple-select work areas. Annual gross income in USD, estimated from salary bands. Groups overlap. Source data
The income contrast is tempting: the published median is about $90,000 for the frontend group and $125,000 for the AI/LLM group. But look at experience beside it: 12 years versus 15 years.
That’s already a reason to slow down before declaring an “AI salary premium.” Geography, job level, employment arrangements, and specialisation also vary. The salary and experience facets use different response subsets, and salary statistics are estimates from income bands, in annual gross US dollars.
The more interesting pattern is that this smaller AI/LLM group includes many experienced engineers. Tooling work has a median experience of 15 years, too. Building the machinery that other developers use seems to sit comfortably alongside substantial experience. The data doesn’t establish that one causes the other.
The model can get ahead of your understanding
The AI-risk answers are a useful counterweight to all that generated code.
What developers are worried about with AI
4,849 answers- Job displacement54.7%
- Low-quality AI content47.4%
- Cognitive impact / reduced learning45.2%
- Security issues35.0%
Percent of this question's respondents. Multiple selections allowed; categories overlap. Concerns, not incident rates. Source data
Job displacement and low-quality AI content lead these four concerns, but the 45.2% worried about cognitive impact is particularly interesting. That option describes excessive use leaving people dependent on AI. It measures a worry, not a demonstrated loss of skill.
Here’s a possible failure mode: a model produces something that works before the developer understands why it works.
That can be convenient. It can also be a nasty place to stop. In an unfamiliar codebase, a passing example might hide the important constraint. Authentication has permission boundaries. Databases have transactions. Infrastructure has state. Concurrency has an impressive talent for saving its surprises until production.
During an incident, “the model said it was fine” isn’t much of a recovery plan.
AI can make particular tasks much faster without making those constraints disappear. A reasonable interpretation is that deep engineering understanding becomes more valuable as generation gets easier. The skill shifts toward understanding the system, verifying the change, spotting the failure mode, and recovering when something breaks.
This is an argument for using AI with enough context and verification to make its output useful. Blindly accepting more code is a much narrower ambition.
Worried about a job change, or a career change?
Those aren’t the same question, and the survey asks both.
42.4% of job-security respondents said an involuntary job change within five years was somewhat or very likely. For an involuntary career change, the equivalent figure was 26.2%. The questions received 5,310 and 5,334 answers respectively.
The exact wording is “change careers.” It doesn’t directly ask whether programming will disappear, and neither question specifies AI as the cause.
Still, the gap is interesting. There seems to be more anxiety about employment instability than about having to leave a career altogether. One possible reading is a reshuffling of roles, expectations, and skills. These answers can’t tell us what the next five years will actually bring.
Powerful tools, tired developers
The workplace results deserve a pause. These are experiences reported across a career, followed by a separate question about how work has felt recently.
Problems experienced during a career
5,352 answers- Bad management63.0%
- Burnout62.5%
- Work-life balance issues58.2%
- Boredom54.3%
- Job insecurity48.2%
- Mental-health-related issues47.7%
- Insufficient wages45.8%
Percent of this question's respondents. Multiple selections allowed; categories overlap. Source data
And how work has felt recently
4,484 answers- Reduced motivation65.6%
- Increased cynicism60.2%
- Emotionally drained56.9%
- Increased procrastination53.3%
Percent of this question's respondents. Multiple selections allowed; categories overlap. Source data
Bad management and burnout both sit above 60%. Work-life balance problems, boredom, job insecurity, mental-health-related issues, and insufficient wages aren’t rare side notes either.
A small data-reading trap: the work-life balance bucket is internally called excessive_overtime, but the survey’s displayed label is “Work-life balance issues.” The chart follows the public wording rather than pretending every answer means the same thing as a recorded overtime count.
The recent-experience question is uncomfortable reading, too. Reduced motivation reaches 65.6%, increased cynicism 60.2%, and feeling emotionally drained 56.9%. These are self-reported experiences, not clinical diagnoses.
There’s an interesting tension here. The conversation around coding tools promises enormous productivity gains, while many developers describe work as draining and less rewarding. This dataset doesn’t establish that AI caused burnout, or that those promises have been realised.
What it does suggest is that more output doesn’t automatically translate into a better developer experience. Faster generation can coexist with poor management, growing review queues, and unrealistic expectations. A team can produce more code and still have a miserable Tuesday.
Remote work didn’t vanish
With all that uncertainty, here’s a less dramatic finding: remote flexibility is still deeply embedded in this sample.
Remote flexibility is still here
4,585 answers- Hybrid41.3%
- Employee choice30.2%
- Fully remote23.5%
- No remote work5.0%
The four main categories sum to 100%. Additional freeform tags are not separate groups. Source data
Hybrid is the biggest category at 41.3%. Employee choice accounts for 30.2%, and exclusively remote organisations for 23.5%. Only 5.0% reported no remote work.
Fully remote isn’t the dominant arrangement. But a compulsory daily commute isn’t the default here either. The extra freeform tags in the JSON overlap the main categories, so adding them as extra slices would quietly double-count answers. JSON: helpful, occasionally mischievous.
A small detour: Spain’s salary subset
The Spain salary facet contains 140 records. Its published mean is approximately $70,500, with these quartiles:
| 25th percentile | Median | 75th percentile |
|---|---|---|
| $45,000 | $70,000 | $90,000 |
Those are annual gross USD figures derived from the survey’s income bands. The subset is small beside the full survey and self-selected. Seniority and specialisation vary, and contractor income isn’t necessarily comparable with employee compensation. It’s an interesting public data point, not a benchmark for what anyone ought to earn.
The interesting work moves around the code
My reading is that this dataset gives little support to a simple story in which programming disappears. It shows widespread AI-assisted coding, a smaller group building AI systems, and plenty of uncertainty about work.
As generation gets easier, typing out the implementation becomes a less distinctive part of the job. Understanding systems, defining the problem, reviewing changes, designing architecture, debugging failures, securing software, and making good decisions still require judgment.
The funny thing about better coding models is that they make the surrounding engineering work harder to ignore. What happens when reality disagrees with the model? Someone still needs to understand the system well enough to find out.
This analysis only scratches the surface. I built the scraper because I wanted a few extra answers. Now I have several megabytes of JSON and considerably more questions.
Under the hood: data, denominators, and sources
The scraper started at /page-data/en-US/page-data.json, followed pageContext.next.path and previous.path, and downloaded all 11 linked English result pages on October 1, 2026. The survey ran from July 5 to September 5, 2026.
Every chart above is calculated from the local snapshot, using the response count for its question rather than all survey participants. Salary and experience medians come from the site’s published facet statistics. Missing answers and overlapping multi-select categories matter; the smaller AI/LLM and country subsets deserve additional caution.
The sample largely comes from the Devographics audience and social media. These are observations about those respondents, with interpretations layered on top. They aren’t population estimates, causal results, or controlled comparisons of AI tools.